
**Static Experiment:**
**Required Equipment:** 1L beaker, small aeration device, micro-electrolytic filler, acid, alkali, coagulant.
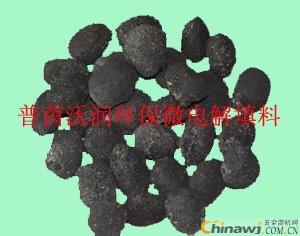
Start by placing 1 kg of the micro-electrolytic filler into the 1L beaker. Insert an aeration head at the bottom to create a simple aeration system. Next, add the wastewater to be tested—without filling it completely—and turn on the aeration. Adjust the aeration rate to match the desired process conditions.
**Time Adjustment:** The experiment can be conducted in different time intervals such as 30, 45, 60, or 90 minutes, depending on the required reaction time.
**pH Adjustment:** Adjust the pH of the solution to values like 2, 3, 4, 5, and 6, and measure the pH of the effluent after each test. This helps evaluate the impact of pH on the treatment efficiency.
After the reaction is complete, pour out the wastewater. Then, adjust the pH to between 8 and 9 using lime or liquid alkali to induce flocculation. A small amount of coagulant, such as PAC, may also be added. Finally, collect the supernatant for further analysis and testing.
**Dynamic Experiment:**
The dynamic test simulates a real reactor setup for continuous wastewater treatment. Based on site conditions and wastewater characteristics, the reactor design can be customized. To estimate the treatment capacity, consider that the specific gravity of the filler is 1 ton per cubic meter, with a microporosity of 65%. Assuming a 60% efficiency, one cubic meter of filler can treat 0.6 cubic meters of water per hour. If the test runs for 30 minutes, the hourly processing capacity would be 60/30 × 0.6 = 1.2 cubic meters per hour. Similar calculations apply for other time intervals.
**Iron-Carbon Filler Experiment – Comprehensive Wastewater Treatment Technology Summary!** ---186--63-64-04-92
Iron-carbon filler technology has proven effective across various types of industrial wastewater. Here’s a summary of its applications:
1. **Printing and Dyeing Wastewater:** The micro-current and magnetic field effects between iron and carbon can break down chromophores, effectively decolorizing the wastewater.
2. **Electroplating and PCB Wastewater (Heavy Metal Complexes):** The new ecological iron ions produced during the process reduce heavy metal complexes. Combined with electrophoretic effects and iron hydroxide precipitation, this significantly reduces heavy metals and COD levels.
3. **Nitrobenzene, Aniline, Coking, Petrochemical, Hydrogen Peroxide, Rubber Auxiliary, and Benzene Ring Wastewater:** A 1.2V potential difference between iron and carbon generates a magnetic field that disrupts carbon chains and rings, breaking down complex compounds and improving biodegradability. This converts refractory wastewater into more easily degradable forms.
4. **Pharmaceutical Wastewater:** The micro-current effect helps convert stable organic compounds into more degradable substances, reducing COD and eliminating pathogens in hospital wastewater.
5. **Papermaking Wastewater:** The micro-electrolysis, magnetic, and redox effects can break down long-chain polysaccharides into simpler sugars, greatly enhancing biodegradability and making it easier to remove with Fenton reagent.
6. **Livestock and High-Concentration Organic Wastewater:** Micro-electrolysis breaks down complex organic structures, reduces COD, ammonia nitrogen, and phosphorus content, and removes color-causing groups.
**Iron Micro-Electrolysis Filler Experiment – Detailed Data on Various Wastewaters!** ---186--63-64-04-92
Here are some real-world results from different wastewater treatments:
1. **Pig Farm Wastewater:** Initial COD: 12,163.05 mg/L, Ammonia Nitrogen: 1,080.16 mg/L; After denitrification tower: COD: 1,790.43 mg/L, Ammonia Nitrogen: 13.28 mg/L; After micro-electrolysis: COD: 384.27 mg/L.
2. **Electroplating Wastewater:** Raw Water COD: 945 mg/L; After micro-electrolysis: COD: 135 mg/L.
3. **Nitrobenzene Wastewater:** Raw Water COD: 3,800 mg/L, Nitrobenzene: 82.5 mg/L; After Iron-Carbon Micro-Electrolysis + Fenton: COD: 107 mg/L, Nitrobenzene: 0.26 mg/L.
4. **Aniline Wastewater:** Raw Water COD: 5,035 mg/L; After Two-Stage Micro-Electrolysis + Fenton: COD: 113 mg/L.
5. **Modified Starch Wastewater:** Raw Water COD: 12,000 mg/L; After Two-Stage Micro-Electrolysis: COD: 5,875 mg/L.
6. **Cattle Wastewater:** Raw Water COD: 11,034 mg/L; After Two-Stage Micro-Electrolysis: COD: 1,416 mg/L; After Two-Stage Micro-Electrolysis + Fenton: COD: 857 mg/L.
7. **Chemical Wastewater:** Raw Water COD: 20,000 mg/L; After Two-Stage Micro-Electrolysis + Fenton: COD: 1,600 mg/L.
---186--63-64-04-92
**Required Equipment:** 1L beaker, small aeration device, micro-electrolytic filler, acid, alkali, coagulant.
Start by placing 1 kg of the micro-electrolytic filler into the 1L beaker. Insert an aeration head at the bottom to create a simple aeration system. Next, add the wastewater to be tested—without filling it completely—and turn on the aeration. Adjust the aeration rate to match the desired process conditions.
**Time Adjustment:** The experiment can be conducted in different time intervals such as 30, 45, 60, or 90 minutes, depending on the required reaction time.
**pH Adjustment:** Adjust the pH of the solution to values like 2, 3, 4, 5, and 6, and measure the pH of the effluent after each test. This helps evaluate the impact of pH on the treatment efficiency.
After the reaction is complete, pour out the wastewater. Then, adjust the pH to between 8 and 9 using lime or liquid alkali to induce flocculation. A small amount of coagulant, such as PAC, may also be added. Finally, collect the supernatant for further analysis and testing.
**Dynamic Experiment:**
The dynamic test simulates a real reactor setup for continuous wastewater treatment. Based on site conditions and wastewater characteristics, the reactor design can be customized. To estimate the treatment capacity, consider that the specific gravity of the filler is 1 ton per cubic meter, with a microporosity of 65%. Assuming a 60% efficiency, one cubic meter of filler can treat 0.6 cubic meters of water per hour. If the test runs for 30 minutes, the hourly processing capacity would be 60/30 × 0.6 = 1.2 cubic meters per hour. Similar calculations apply for other time intervals.
**Iron-Carbon Filler Experiment – Comprehensive Wastewater Treatment Technology Summary!** ---186--63-64-04-92
Iron-carbon filler technology has proven effective across various types of industrial wastewater. Here’s a summary of its applications:
1. **Printing and Dyeing Wastewater:** The micro-current and magnetic field effects between iron and carbon can break down chromophores, effectively decolorizing the wastewater.
2. **Electroplating and PCB Wastewater (Heavy Metal Complexes):** The new ecological iron ions produced during the process reduce heavy metal complexes. Combined with electrophoretic effects and iron hydroxide precipitation, this significantly reduces heavy metals and COD levels.
3. **Nitrobenzene, Aniline, Coking, Petrochemical, Hydrogen Peroxide, Rubber Auxiliary, and Benzene Ring Wastewater:** A 1.2V potential difference between iron and carbon generates a magnetic field that disrupts carbon chains and rings, breaking down complex compounds and improving biodegradability. This converts refractory wastewater into more easily degradable forms.
4. **Pharmaceutical Wastewater:** The micro-current effect helps convert stable organic compounds into more degradable substances, reducing COD and eliminating pathogens in hospital wastewater.
5. **Papermaking Wastewater:** The micro-electrolysis, magnetic, and redox effects can break down long-chain polysaccharides into simpler sugars, greatly enhancing biodegradability and making it easier to remove with Fenton reagent.
6. **Livestock and High-Concentration Organic Wastewater:** Micro-electrolysis breaks down complex organic structures, reduces COD, ammonia nitrogen, and phosphorus content, and removes color-causing groups.
**Iron Micro-Electrolysis Filler Experiment – Detailed Data on Various Wastewaters!** ---186--63-64-04-92
Here are some real-world results from different wastewater treatments:
1. **Pig Farm Wastewater:** Initial COD: 12,163.05 mg/L, Ammonia Nitrogen: 1,080.16 mg/L; After denitrification tower: COD: 1,790.43 mg/L, Ammonia Nitrogen: 13.28 mg/L; After micro-electrolysis: COD: 384.27 mg/L.
2. **Electroplating Wastewater:** Raw Water COD: 945 mg/L; After micro-electrolysis: COD: 135 mg/L.
3. **Nitrobenzene Wastewater:** Raw Water COD: 3,800 mg/L, Nitrobenzene: 82.5 mg/L; After Iron-Carbon Micro-Electrolysis + Fenton: COD: 107 mg/L, Nitrobenzene: 0.26 mg/L.
4. **Aniline Wastewater:** Raw Water COD: 5,035 mg/L; After Two-Stage Micro-Electrolysis + Fenton: COD: 113 mg/L.
5. **Modified Starch Wastewater:** Raw Water COD: 12,000 mg/L; After Two-Stage Micro-Electrolysis: COD: 5,875 mg/L.
6. **Cattle Wastewater:** Raw Water COD: 11,034 mg/L; After Two-Stage Micro-Electrolysis: COD: 1,416 mg/L; After Two-Stage Micro-Electrolysis + Fenton: COD: 857 mg/L.
7. **Chemical Wastewater:** Raw Water COD: 20,000 mg/L; After Two-Stage Micro-Electrolysis + Fenton: COD: 1,600 mg/L.
---186--63-64-04-92
Shower Column,Shower Column Set,Delta Shower Column,Thermostatic Shower Column
JANGMEN MOON SHOWER SANITARYWARE CO.,LTD , https://www.moonshowerglobal.com